Inventory dashboards
The following dashboards, available via the Odoo Dashboards app, allow you to monitor and analyze core metrics related to warehouse operations and management, as well as stock management:
Warehouse Daily Operations dashboard: monitors task completion and scheduled activities
Operation analysis dashboard: measures efficiency KPIs
Warehouse Metrics dashboard: assesses stock value and quantity
To access these dashboards, go to the Dashboards app, then, in the left panel, navigate to the Logistics section and click the name of the relevant dashboard. The dashboard opens in the main view.
Note
The rights to access Odoo dashboards are based on user groups, and are managed within the Dashboards app. By default, the Operation analysis and Warehouse Metrics dashboards are only visible to, and can only be accessed by, users with admin access to the Inventory app.
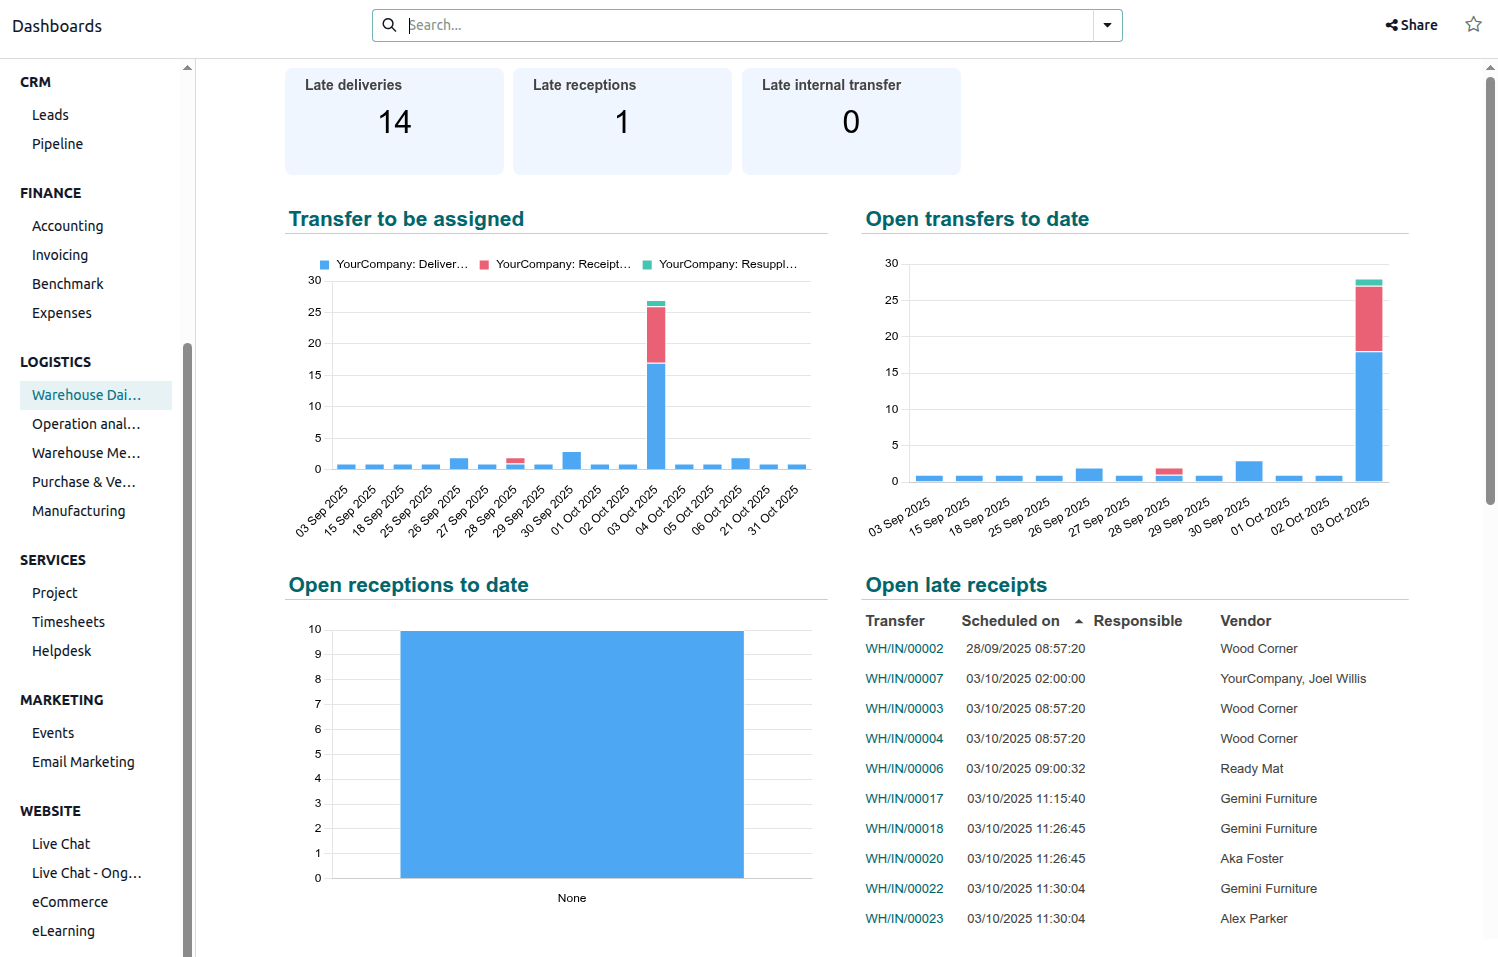
Warehouse Daily Operations dashboard
The Warehouse Daily Operations dashboard provides a real-time view of critical outstanding tasks across receipts, deliveries, and internal transfers, allowing warehouse managers to prioritize work and prevent bottlenecks. It immediately identifies overdue operations, as well as transfers that have not yet been assigned to an employee. It also forecasts scheduled activity for the next 7 days.
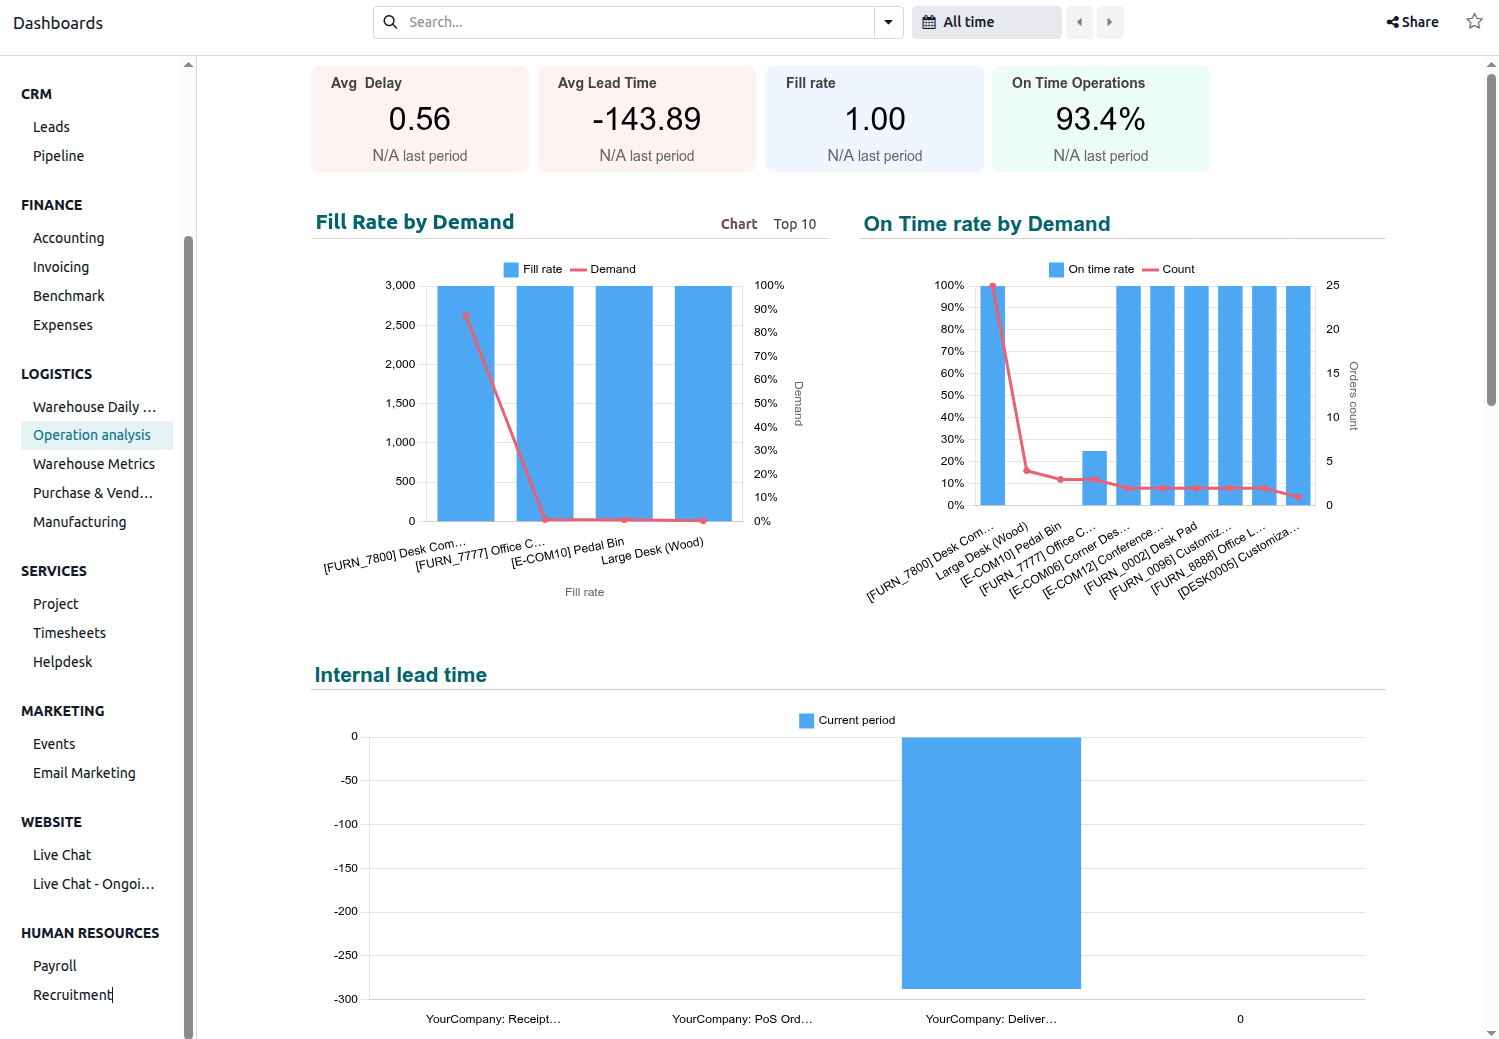
Operation analysis dashboard
The Operation analysis dashboard focuses on KPIs related to the efficiency and accuracy of stock movements. It helps identify areas for process improvement by showing metrics like the average time transfers are overdue, the average time between creation and validation of transfers, and the percentage of on-time transfers. It also provides insights into delivery accuracy by showing the percentage of products actually delivered versus ordered.
Tip
By default, this dashboard shows data for All time. To show data for a specific period, click All time above the dashboard and select or define the appropriate period.
For a more precise analysis, filter the dashboard by operation type via the search bar.
Navigate the dashboard
Four cards at the top of the dashboard show the following information:
Avg Delay: indicates the average number of days, in decimal format, that completed deliveries were overdue (i.e., the date the delivery status changed to Done minus the scheduled date for the delivery) in the selected period.
Note
Deliveries that are completed earlier than their scheduled date contribute a negative delay value to the calculation of the KPI.
Avg Lead Time: indicates the average number of days, in decimal format, between the creation and the validation of transfers.
Fill rate: indicates the percentage of products delivered in relation to the total number of products ordered.
Note
When no backorder is created, this KPI decreases.
On Time Operations: indicates the percentage of transfers made on time for the selected operation (i.e., the transfer date is less than or equal to scheduled date for the transfer).
The following charts are available:
Fill Rate by Demand: shows the percentage of products delivered in relation to the total number of products ordered.
Tip
When no backorder is created, this KPI decreases.
On Time rate by Demand: shows the percentage of transfers made on time by product.
Internal lead time: shows the average time between the creation and the validation of transfers by operation.
Moves lines count by operation: shows the total number of completed stock move lines by operation type over the selected period.
Weekly Stock Moves Lines by operation: shows the total number of completed stock move lines weekly, by operation type.
Transfer count by responsible and operation: shows the number of transfers by employee, detailing the type of operation.
Quantity of stock adjustments by category: shows adjusted stock quantity, by product category.
Qty scrapped product by category: shows the quantity of product scrapped, by product category.
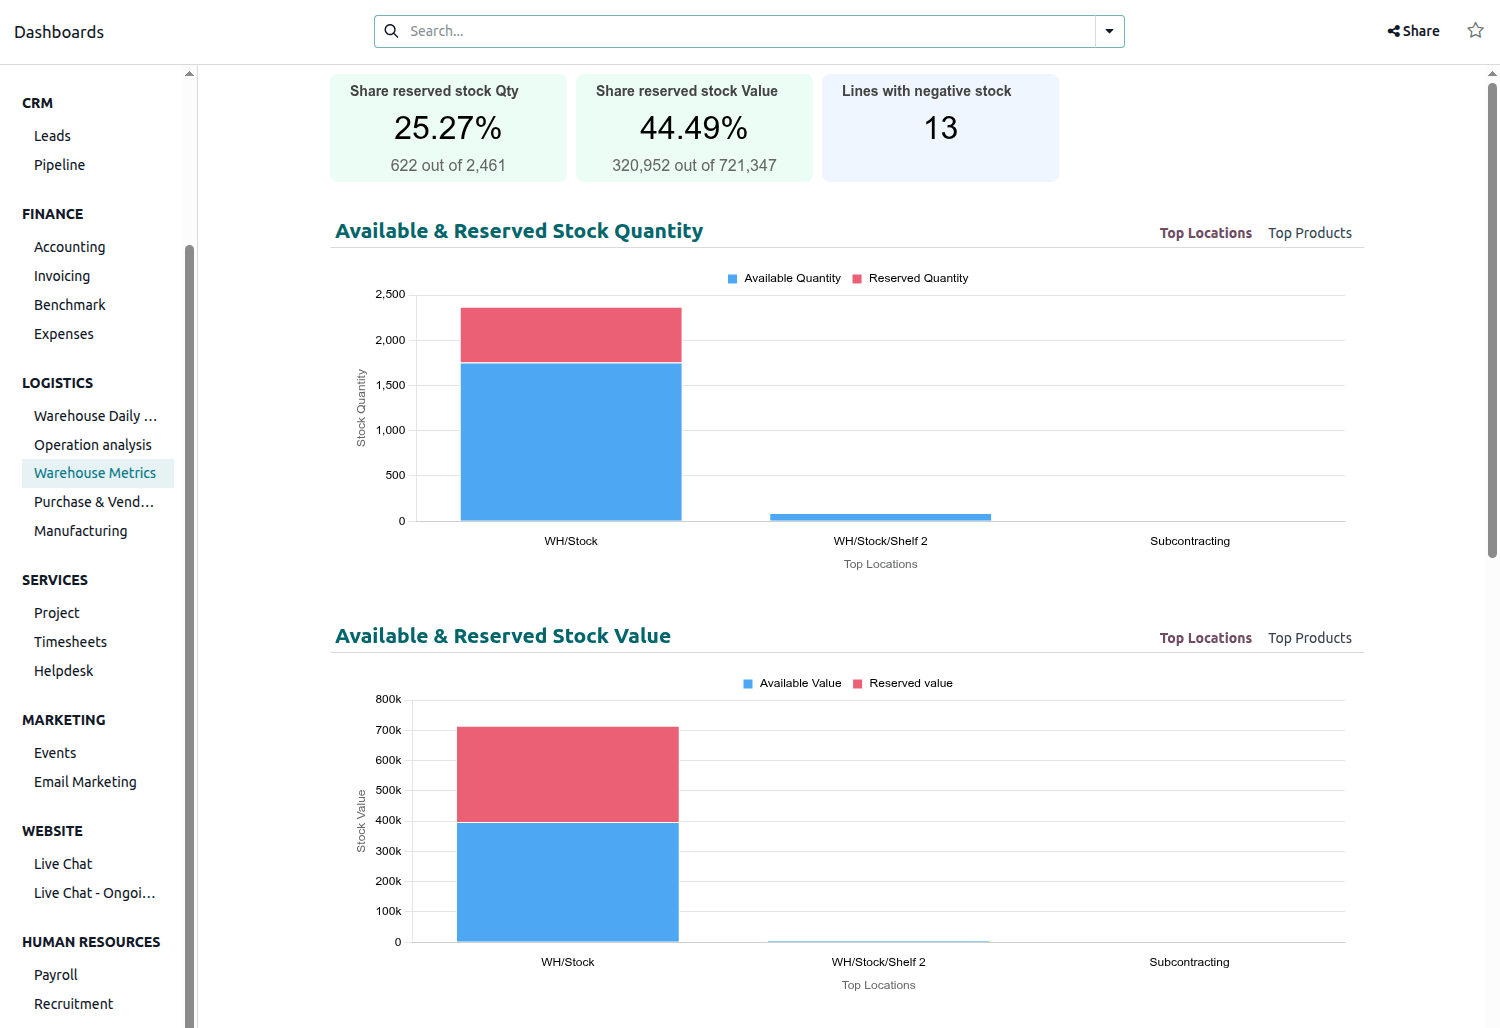
Warehouse Metrics dashboard
The Warehouse Metrics dashboard provides a high-level view of the value and availability of stock. It enables monitoring of stock reservation levels both in quantity and value, identification of products with negative stock, and analysis of stock distribution and value across the most used locations and top products. It also tracks important details like the creation date of stock, so warehouse or purchasing managers can identify slow-moving or stagnant products and take action, such as promoting, discounting, or returning products.
Note
The value of stock depends on the valuation method used.
Tip
For a more precise analysis, filter the dashboard by product via the search bar.
Navigate the dashboard
Three cards at the top of the dashboard show the following information:
Share reserved stock Qty: indicates the quantity of stock reserved in relation to the total quantity of stock on hand, both as a percentage and number.
Share reserved stock value: indicates the value of reserved stock in relation to the total value of stock on hand, both as a percentage and number.
Lines with negative stock: indicates the number of inventory lines with a negative stock quantity.
The following charts are available:
Available & Reserved Stock Quantity: shows the quantity of available stock (i.e., stock on hand minus reserved stock) and the quantity of reserved stock, per most-used location. At the top right of the chart, click Top Products to see this information for the top products, i.e., the products with the highest quantities.
Available & Reserved Stock Value: shows the value of available stock (i.e., stock on hand minus reserved stock) and the value of reserved stock, per most-used location. At the top right of the chart, click Top Products to see this information for the top products, i.e., the products with the most total value.
Ageing stock qty by product and creation date: shows, by product, the quantity of stock that has been held since its creation. To change the creation date period, hover over the chart then select the desired period from the dropdown.
Note
For products not tracked by lot/serial number, this chart only displays the date of first receipt except if the stock went down to 0.
Ageing stock value by product and creation date: shows, by product, the value of stock that has been held since its creation. To change the creation date period, hover over the chart then select the desired period from the dropdown.
Top 10 products with negative stock: shows the ten products with the most negative stock. Depending on the situation, manual stock corrections may be needed for products shown here. By default, this is shown as a donut chart; click Top 10 at the top right of the chart to see this in list form.